The trend strategy described below is one which should be classified in long-term strategies category. In the first moment, you can think that this strategy should be used on lower time frames because it has many common things with well known and respected Price Action strategy. However, when we look closer we will understand that this approach to the market uses relations which can be easily called macroeconomic. The essence lies in the fact that this approach use a chart instead of complicated econometric models.
The aim of this strategy is an approach to the chart as a source of any information about current sentiment. In addition, the chart is supported by instruments’ analysis with which chosen instrument has a huge correlation, both positive and negative. In this place we should ask about the definition of correlation and why trader who needs to analyze proper instrument would need analysis of other instruments, which in addition are from completely different class assets.
Correlation is a name of dependency which happen between different instruments. On this basis, we can set how strong this dependency is, whether strength or weakness of one instrument will influence the other one. Correlation is measured by so called correlation coefficient, its task is to define this power. The correlation coefficient is in range (-1,+1). The value +1 means a perfect positive correlation. The perfect positive correlation between instruments A and B means that gain of instrument A of a certain value will cause instrument B gain the same one. In case of decrease of instrument A, instrument B will lose with the same power. On the other side perfect negative correlation assumes that in case of gain in the value of instrument A, the instrument will lose the same value as instrument A gained. In the case of depreciation of instrument A, instrument B will gain. When the correlation coefficient equals to 0 that means that there is no dependency between two instruments, they are totally independent.

Positive correlation
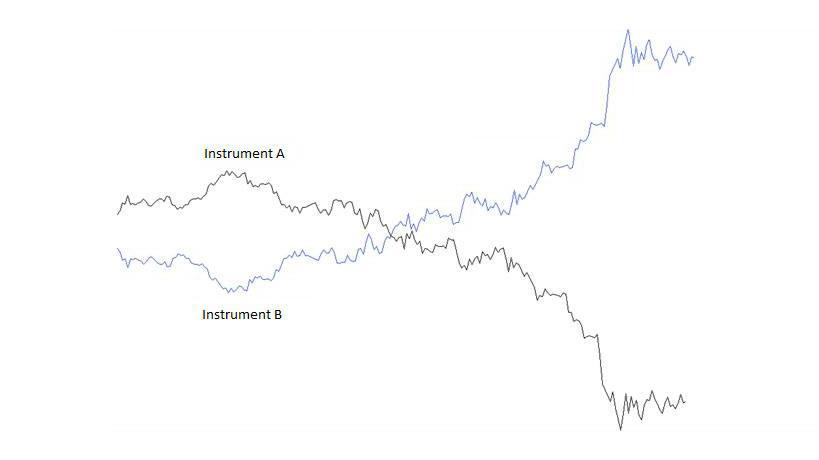
Negative correlation
Now that we already discussed how one instrument affects another one, it is worth to think about where we should look for those connections. We can start by finding proper tools to analyze the strength of connections between two instruments, for example, Forex market currency pairs. Another method is to use natural relations between markets which we know from Intermarket analysis. Intermarket analysis is the study of the relationships between different markets. The analysis itself as a base takes a few assumptions mentioned below:
- All markets are correlated, none of them works in a “vacuum”
- We use all information sources needed to analyze the market
- Technical and fundamental analysis are used to a proper evaluation of the situation on the markets
According to the assumptions of this analysis, there is a positive correlation between the stock market and bond market. On the other hand, there is a negative correlation between the US dollar and commodities, because commodities are quoted in USD. There is also a negative correlation between the bond market and commodities, the price of commodities rise because of inflation. Thanks to this view on the market it is easier to look for relations between instruments.
Tools used in strategy
Intermarket analysis is not used as a replacement of any view on the market, just as its complement. In this strategy, we use a mostly holistic concept which relies on the market view assuming broad view thanks to which trader will find confirmation of his trading assumptions. The basic thing for a trader is to choose an instrument which he will be interested in. Then he reviews the trend on the D1 chart. To identify trend we use the location of local lows and highs comparing to each other. We identify it by choosing any extremum point on the chart and then connecting another highs to lows and lows to highs. At the moment we have doubt whether we should consider the proper place as local extremum or not we can use the help of classical technical analysis, we can localise them using swing high/swing low method. This method is used to set local lows and highs.

At the moment there is a candle with a lower low than two neighbouring candles and then there is a break of new high, we see local low. In the situation when there is a candle with higher high then two candles next to it and then there is a break of new low, we see local low. This way we can set local waves on the markets. We can also use Zig Zag indicator which is available on the MetaTrader 4 platform.
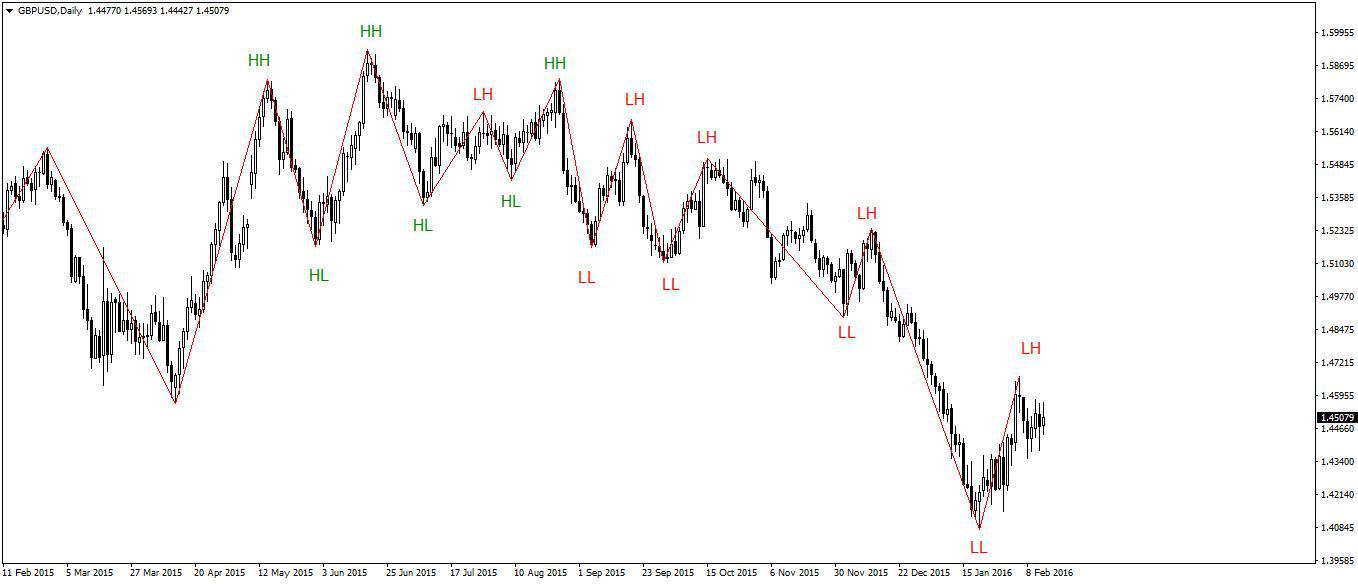
Then we can mark local high and lows which are in relation with each other:
HH – higher high
HL – higher low
LH – lower high
LL – lower low
At the moment we see lower low and highs we can say that the trend is bearish. At the moment when other highs and lows are at higher levels, we identified the bullish trend. At the same time using the same method we can determine the higher-order trend. After identifying high around which there are only higher highs we can set it as the end of the bearish trend and the beginning of bullish one. On the other side when we identify high around which there are only lower highs, we can set it as the assumption of further losses. The same way we set another local lows and highs and also the trend of higher range on correlated instruments. The correlated instrument are these on which we can set the highest positive or negative correlation.
Example
Forex market instrument – GBPUSD, the biggest positive correlation has with AUDUSD pair. The biggest negative correlation it has in comparison with EURPLN. These correlations were set on the base of data from the last 30 days. This way we can confirm that correlated instrument confirms observed sentiment.
Entering position
You can enter the position at the moment when there is a change of trend of higher time frame, which must be confirmed by correlated instruments. In the moment of creating high of higher range (surrounded from both sides by lower highs), a trader waits for confirmation of bearish trend by creating of local high and low (LH, LL). Creation of local low can be confirmed on the base of the swing high signal which was described above. In the case of the bullish trend, the situation looks identical. Correlated instruments must confirm a change of trend. Setting trend on correlated instruments is done with the same rules as on the instrument where the trader will open position.

Exiting position
Stop Loss should be above the previous high in case of bearish trend or below the previous low in case of the bullish trend. The transaction is opened until correlated instruments do not set the end of higher range trend. It will happen at the moment when on identified earlier bearish trend there will be a local low surrounded by higher lows. In the case of the bullish trend, reversal trend situation happens when higher high will be surrounded by lower highs. In the moment of reaching risk-reward ratio on 1:2 level it is worth to consider closing part of the position and moving SL to Break-Even Point.
Capital management
This strategy is long-term and it generates signals quite rare, so the trader can risk as much as 4-5% of the balance on one transaction. Using this big risk is possible only when the trader will use only this strategy. In the moment of using a few different strategies the risk should be reduced to max 2.5-3% because any drawdown can significantly reduce the capital. Remember that capital management is one of the most important aspects of trading and it determines our score.


