This strategy is named after a Japanese technical analysis technique.
We have covered this strategy before but now we will identify strategies that have specific entry and exit levels. This is a crucial element to the trader’s armoury as it is a prime determinant of the investment decision.
The strategy that is described below is a typical trend following strategy that uses a weekly and daily interval. This strategy should therefore be considered as another swing trading methodology.
Tools Used in this Strategy
This strategy uses the Ichimoku ratio as a comprehensive decision-making tool. Therefore, this one indicator is used to determine both the prevailing tendency of a given value, which determines the direction of the entry and the determination of the optimum level of entry. At the same time, the trade is undertaken using Ichimoku to determine the exit level. Initially, the trader uses the method on the weekly chart taking positions at daily intervals according to what the method is predicting.
Entering a Position
First, the trader needs to upload the Ichimoku indicator on his charting system. Most trading systems have a built-in Ichimoku indicator. This simplifies the decision-making process.
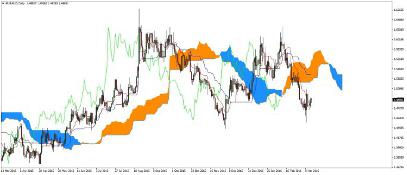
After adding the index to the weekly chart, the trend is determined. For this purpose, use the standard Ichimoku parameters, determined by the creators of the system.
The trend is determined by the price relative to the cloud (kumo) as well as the chikou span. If the price is above the cloud and the chikou span is above the price, the trend is bullish and a long position is indicated. The opposite is true for a bearish of downtrend and a short position is indicated.

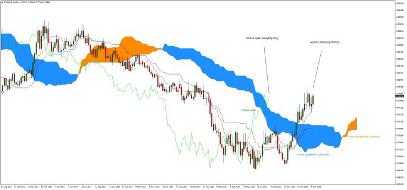
Once the guidelines for determining the trend have been completed, consult a daily chart to find a setup to open a position. Having determined the trend on a weekly chart increases the likelihood of success as the trades will be contained within the upward trend.
On the daily chart, search for setups that are in line with traditional signals using this tool.
However, for the setup to be recognized on the daily chart, the same condition on the weekly chart must be fulfilled. If, for example, an upward trend is identified on the weekly chart, such a setup must also prevail on the daily chart where the price is above the cloud and chikou above the price.
In the case of a downtrend, the price should be below the cloud and the chikou below the price. If the conditions are met, take a position based on the designated support and resistance levels. Based on Ichimoku, key levels are used, using cloud boundaries, the sleepwalker and the chikou span. A rising cloud, naturally, supports an uptrend so when the price starts to rise through the top it is a sign that demand is being tested. In a down trend, the situation is similar.
The sleepwalker is the line representing the average of the highest and lowest levels of the last twenty-six periods. Once this line is defeated by the price, it carries a significant signal that there is an imbalance. Support/resistance using the chikou span is dependent upon the response of this line to the price chart.
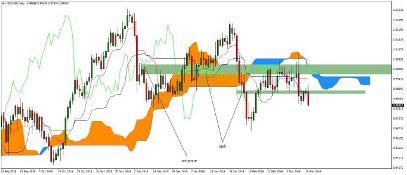
A signal to take a long position appears when the daily chart is protected from kumo, kijum, sleep, or chikou span. The stop loss should be set below these peaks. Comparably, a signal for a short position is confimed when the specified resistance level holds.
This system works well with candle formations that appear at important Ichimoku levels. (Kijun sen, senkou span A, senkou span B). In the case of morning star / evening star, hammer, falling star, we see justification for the position. The continuation of the uptrend is confirmed by the appearance of a hammer or morning star formation or in the case of a downtrend, a falling star or an evening star.
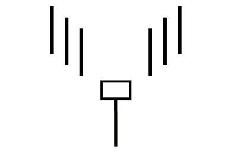
Hammer Formation

Shooting Star Formation
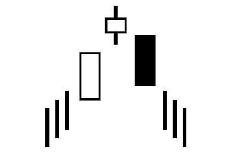
Evening Star Formation

Morning Star Formation
Exiting a position
The time to exit a position occurs when a stop loss or higher interval (W1) is triggered below the cloud. The stop loss should be placed below the support level (in the case of a long position) or above the resistance (in the case of a short position). To determine this level it is appropriate to use a sleep apron, a chikou span or the cloud range.
Another signal to close the position, is should the chikou span break through the price. This denies the trend that was the basis for the position.
Management of Capital
This strategy forms part of the swing trades that use short-term moves to generate revenue.
Additional confirmation of the trend as the price rises increases the probability of success. However from a cash management perspective, no position is 100% guaranteed to be effective. Always defend your position with a stop loss risking no more than 3% of capital per trade.


