Trading strategies that focus on the generation of a specific signal that confirms the direction of a trend. If the methodology generates an appositive return. Alternatively, when the methodology creates doubt it is time to reorganize our thought process. It is a natural process since no one asks questions when we are making money and the adage “if it isn’t broken don’t fix it” applies.
Many traders are constantly concerned that they are using the right signals and indicators. They tweak their method, tinker with the oscillators in to improve the signals. When that doesn’t work, they become more radical, the parameters of the chosen indicators are amended. Eventually, when confronted with a chart full of signals and indicators some agreeing others contradicting a realization occurs that we need to “feel” the market”. Mystical power is not a useful weapon since no one knows when it will arrive or leave. A return to basics is what is needed to achieve a positive return.
The Wide View Strategy (WiViSt) was created specifically for those whose thought has become scrambled. In English, translated from Polish, this is literally the “Broad View Strategy”.
The idea is to identify the medium-term trend following a correction. This then increases the likelihood of success since it assumes a higher trendline position at the end of the correction resulting in a higher risk/reward ratio.
Wide view, or Four Intervals
As a novice trader, I considered how broad my view or perspective should be when I considered the market. My analysis led me quickly to the conclusion that higher intervals have a greater priority of signals. This means that the trend on the hourly chart is more important (and reliable) than the trend on the one minute but the trend on the daily is more important than the trend on the one hour.
Setting a trend on a weekly or monthly chart, it becomes difficult to position ourselves using an hourly chart. The correlation appears awry and leads to the spread between trend and entry positions being too wide to justify and confirm the entry point.
Is your chart sufficiently well-calibrated to allow entering a position? Definition of the issues faced when choosing the most appropriate intervals is a major hurdle to be cleared but using WiViSt, it becomes clear and transparent.
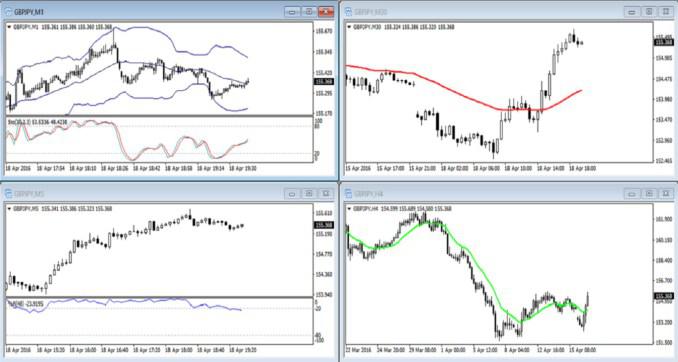
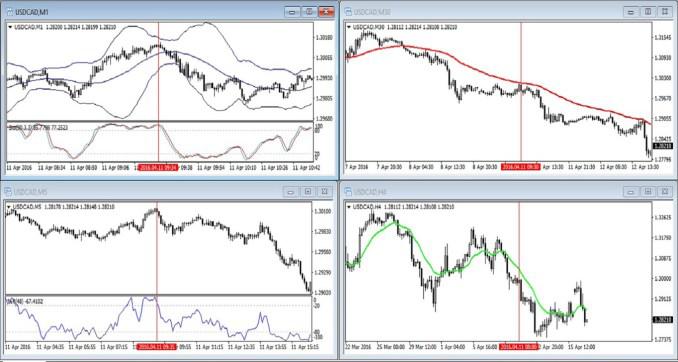
In the following strategy, there are four intervals:
M1
M5
M30
H4
The two charts with longer intervals are used to determine the dominant trend in the market.
The shorter-term charts determine the entry point. This, therefore, covers both the trend and the signal.
Tools used in the WiViSt strategy.
The WiViSt strategy uses the following tools:
- Exponential moving average (EMA)
- Williams Percent range (W%R)
- Stochastic Oscillator (Stoch)
- Bollinger Bands (BB)
These parameters were selected as this strategy was designed specifically for the foreign exchange market.
Add a 15-period EMA to the H4 chart which represents 2.5 trading days. These 2.5 days will represent the benchmark for further consideration of positioning.
The M30 chart also provides analysis for the prevailing trend. This time the trend is analysed for 24 hours so we add a 48-period average and the 48-period EMA.
M5 & M1 charts are used to signal the trader when the position should be opened.
In this strategy, the Williams Percent Range is included on the m5 chart with a 48-period interval. This is not “pulled from the sky”. The 48-period on the M5 assumes the value of a H4 chart.
M1 is loaded with a stochastic using 30.3.3 Bollinger bands.
These settings are also used on the M30 chart to confirm that this setup creates a correct entry level.
Signal Input
When the average on the H4 chart is below the price and the angle of inclination denotes and uptrend, observe the M30 chart to see if the formation is similar. If this is confirmed the M5 and M1 charts will move lower to trigger the signal. When the W%R range is in an overtaking area (<20), the M1 should determine the potential for the trade.
This potential is confirmed by a buy signal on the Stoch which is in an undervalued state. So, now the trader has identified the downtrend, he will look for a revision on M5 together with a sell signal on M1 in the buyout area of the stoch.
When all these signals are complete, the position is heading towards the H4 and M30 and the trend is complete.
Exit signal
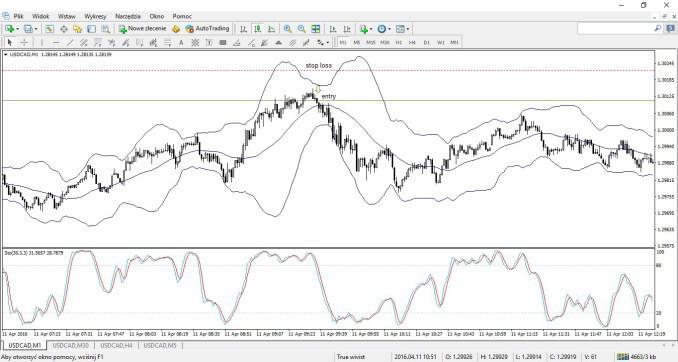
This strategy uses Bollinger Bands to set the stop loss, not to set an entry-level. After going long, the SL is placed below the Bollinger Bands on the M1 chart.
This is obviously reversed in the case of a short position when the stop is set above the Bollingers.
As the Bollinger Bands have three standard deviations, the S/L is a reasonable distance from the price. It is unlikely that a 30-period average BB will be within the narrow range.
In a WiViSt strategy, two types of orders are used.
1. Strong TP at double original SL – If the SL is 30 pips, the TP is automatically set at 60 pips. This is beneficial to day traders who can set and forget having decided upon a WiViSt structure.
2. Trailing Stop.
3. The second approach is more systematic. When the price reaches twice the profit, the trader takes half his profit. He then creates a SL for twice the original SL Thus the trader allows himself to post a profit above the average as the trend is maintained while accepting the risk of a lower profit than the first option.
Capital Management
This strategy is suitable for day-trading giving the advantage to set and leave. Risking 1% of capital is recommended since the SL is set much closer than in other short and medium-term structures


