Daytrading systems are very popular among retail customers. Their popularity is based on that daytrading transactions often use the strength of huge leverage and short term moves which let to have higher exceptional high returns from trading. Daytrading is very popular way of earning for leaving of many people. Each day is a new beginning because we do not leave transaction for the next day, we close them during session. It is very important because it gives clear message – each day you can see how much you earn or lose and you know if this is something for you and if it will let you resign from regular work and leave from trading. Daytrading also gives answer to the question whether some strategy will earn or not. Today we will focus on one of them, however the answer to the question whether it brings profit or not depends on you. You can right now open demo account, configure the strategy below and start the tests.
Tools used in Parabolic SAR strategy
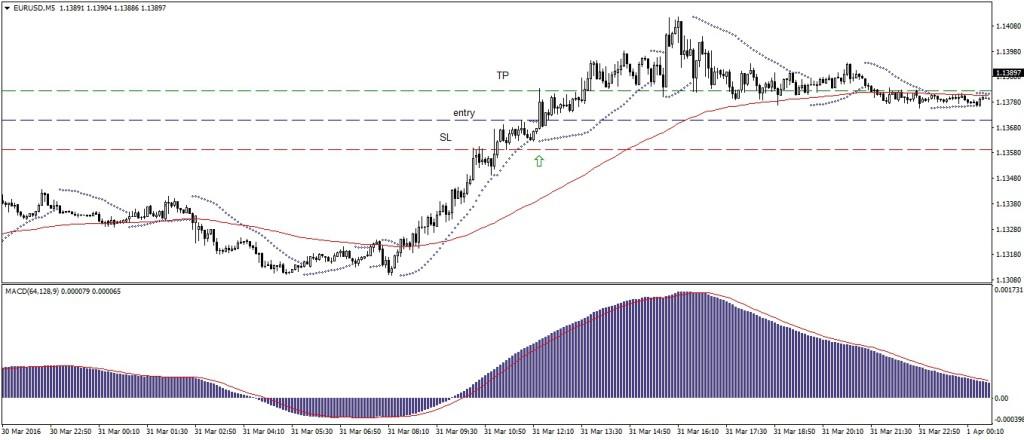
This system is used on the 5-minute chart (M5) on such instruments as EURUSD, GBPUSD or AUDUSD, which have huge volatility on small time frames. The base f this system is Parabolic SAR indicator – stop and reversal – which consider not only “pure” historic data on which it can base probability of increase or decrease of the price, but it adds also element of trend speeding up. It lets to increase probability of success in this case, because when using Parabolic SAR potential stop loss is moving in pair with the price. It is a perfect tool to use in strong trends. In moments of consolidation, it will generate weak quality signals and just increase the chance of losing capital. Parabolic SAR settings are 0.01 (step) and 0.01 (maximum). During trading with this tool it is really important to use different filters which help the trader to find answers if it is really strong trend or Parabolic SAR just generates wrong signals. First filter to put on the price screen is exponential moving average EMA 100. Another one will be MACD oscillator which has values 64 (quick average), 128 (slow average) and 9 (signal line). In this strategy, you just need a standard tool which is MACD with signal line and histogram, well known from standard settings of MT4 platform. Connecting these two tools let us increase the probability of success of the transaction thanks to that higher frequency of the trading will not mean big losses of capital.
Entering the position
You enter the long position when Parabolic SAR will generate buy signal. Buy signal happens in the moment when price will be above Parabolic indicator. When signal is generated, EMA 100 must be below price chart and MACD must be above zero. Similar situation is in short positions, the difference is the price will break the indicator from up to down. In this moment price will be below the Parabolic indicator. At the same time EMA from last 100 periods has to be above price and MACD must be below zero.
Exit from position
In the moment when price breaks level of Parabolic indicator, it is automatically below the price in case of buy signal or above in case of a sell signal. This change is key to setting the Stop Loss. Stop Loss order is in this case 3 pips below indicator in case of buy order or 3 pips above in case of the sell order. Take Profit is 12 pips from the place of opening transaction which in most cases gives positive risk/return ratio.
Capital management
Because of opening transactions very often it should be considered that rational way is to set Stop Loss no bigger than 0.5% of capital on the investment account.


