In short-term strategies, there are often used all kinds of indicators, which is a natural issue for low time frames, as we need to be sure that we are not dealing with the “noise” on the chart but authentic trend movement. There can be a variety of ways, using both oscillators or indicators, and also using the chart. When you give up using oscillators or indicators to define the trend, you should use different time frames which will allow you to better understand the situation, which side has become a dominant force in the market – bulls or bears. More about time intervals you will find in this article.
Tools used in Price Action Candle Power Strategy
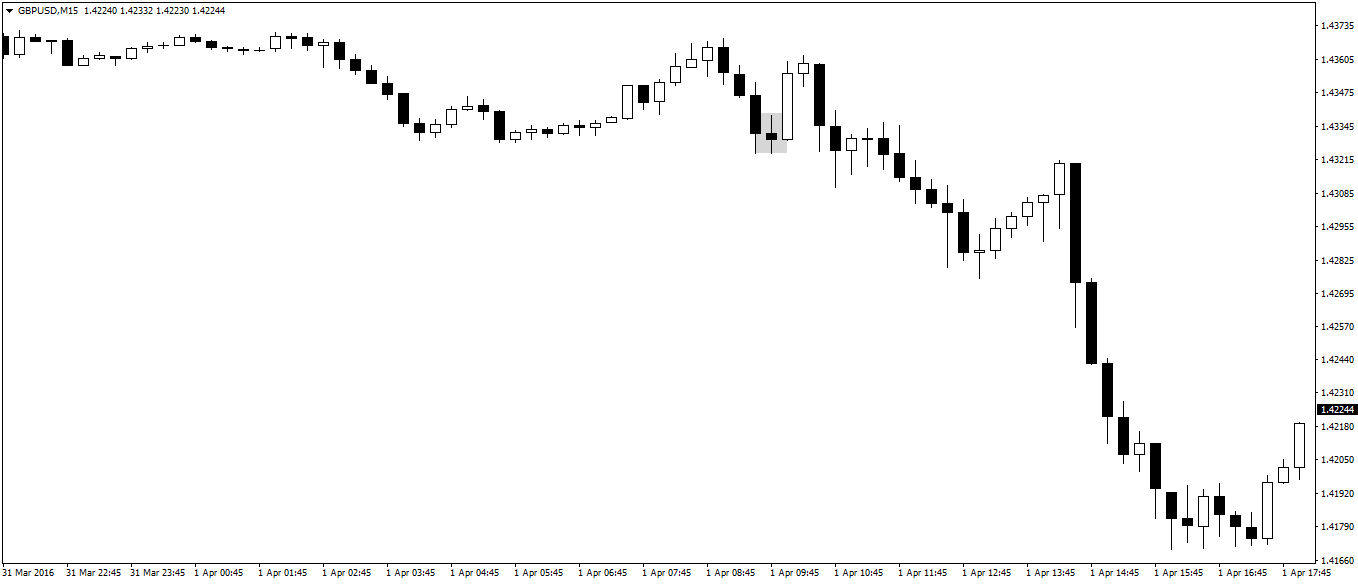
The Price Action Candle Power strategy use only “pure chart” without the help of any oscillators. As a filter, we use different time frames that allow us to answer the fundamental question whether the moves we can observe on chart are a momentary “abnormal power” resulting from the uncertainty of the participants of the market as to the further positioning or perhaps a significant movement that determines the further trend in a selected instrument. In this strategy, we use only four intervals – hourly (H1), a four-hour (H4), a thirty-minutes (M30) and a five-minutes (M5). Learn more about Price Action.
Entering a position
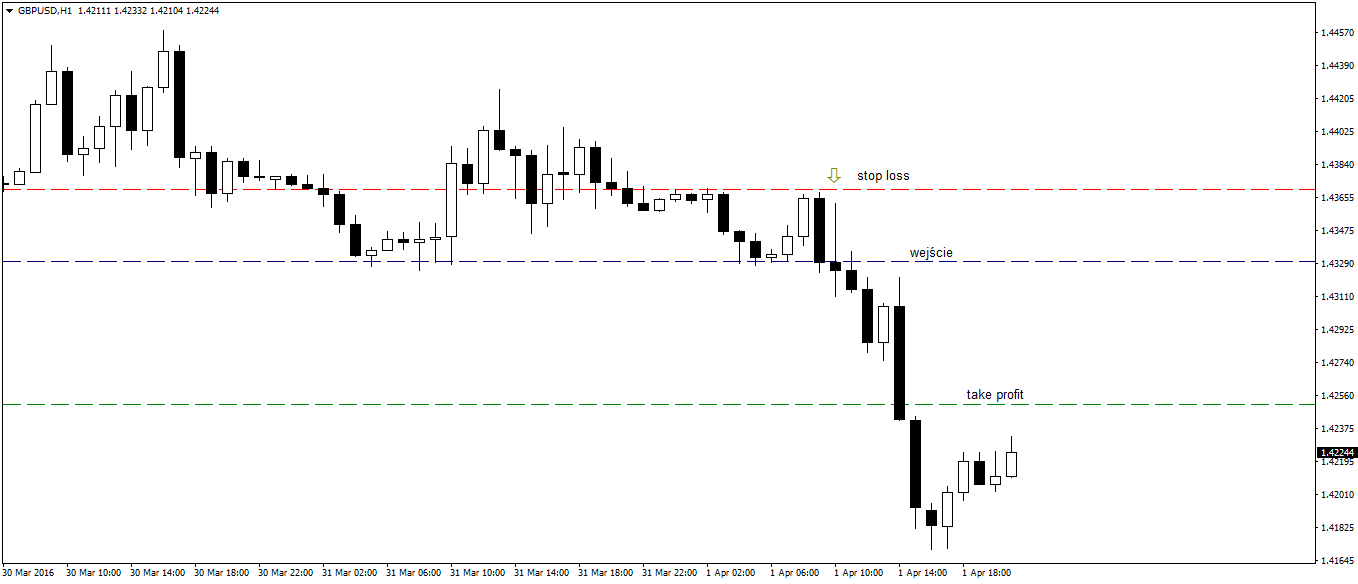
In the following strategy, we open position only on the full hour when it comes to closing of the H1 candle. The moment in which the candle closes in a particular direction (upward or downward), we go to the M30 chart in order to verify that the last candle has also the same “direction of closure”. In case we find such one we move to M15 and M5 charts. If we state such fact that the direction of closure in all four different intervals is the same then we open transaction in accordance with an indication of the last candle on H1 chart.
This means that in a situation where all candles of these intervals indicate the dominance of a bear market then we open a short position. In contrast, when each of the candles closes above the opening, then we can safely say that the market is ruled by the bears and then we open a long position.


Getting out from position
In any investment strategy, also in this one, the trader’s goal is to cut losses and maximize profits. Stop loss is placed below the hour candle (H1) in the case of a buy, while above the H1 candle for the transaction of sell. Take profit is placed at twice the SL (risk/reward – 1:2) to be able not only gain from higher efficiency but also to benefit from the positive relation of profit to risk.
Capital management
Because transactions are only opened on the full hour, this allows to use investment opportunities, without interfering with our job or private duties. As setups shape relatively less often than in other strategies using low timeframes, the maximum risk on a single transaction should not exceed 1% of the funds allocated for trading. Also, find out whether it is worth to use Stop Loss and Take Profit in trading the markets.


